
In the fast-paced world of financial markets, making informed trading decisions is crucial. One of the most potent tools in a trader’s arsenal is technical analysis. By studying chart patterns and using various indicators, traders can gain valuable insights into market trends and potential price movements. In this comprehensive guide, we will delve into the power of technical analysis, exploring how chart patterns and indicators can help you become a more successful trader.
Understanding Technical Analysis
Technical analysis involves the examination of historical price charts and the use of various indicators to forecast future price movements. It is based on the belief that historical price and volume data can provide valuable insights into market psychology and potential future price direction.
Chart Patterns
- Head and Shoulders: This pattern signals a potential trend reversal. It consists of three peaks, with the middle peak being higher than the other two. A break below the neckline indicates a bearish trend.
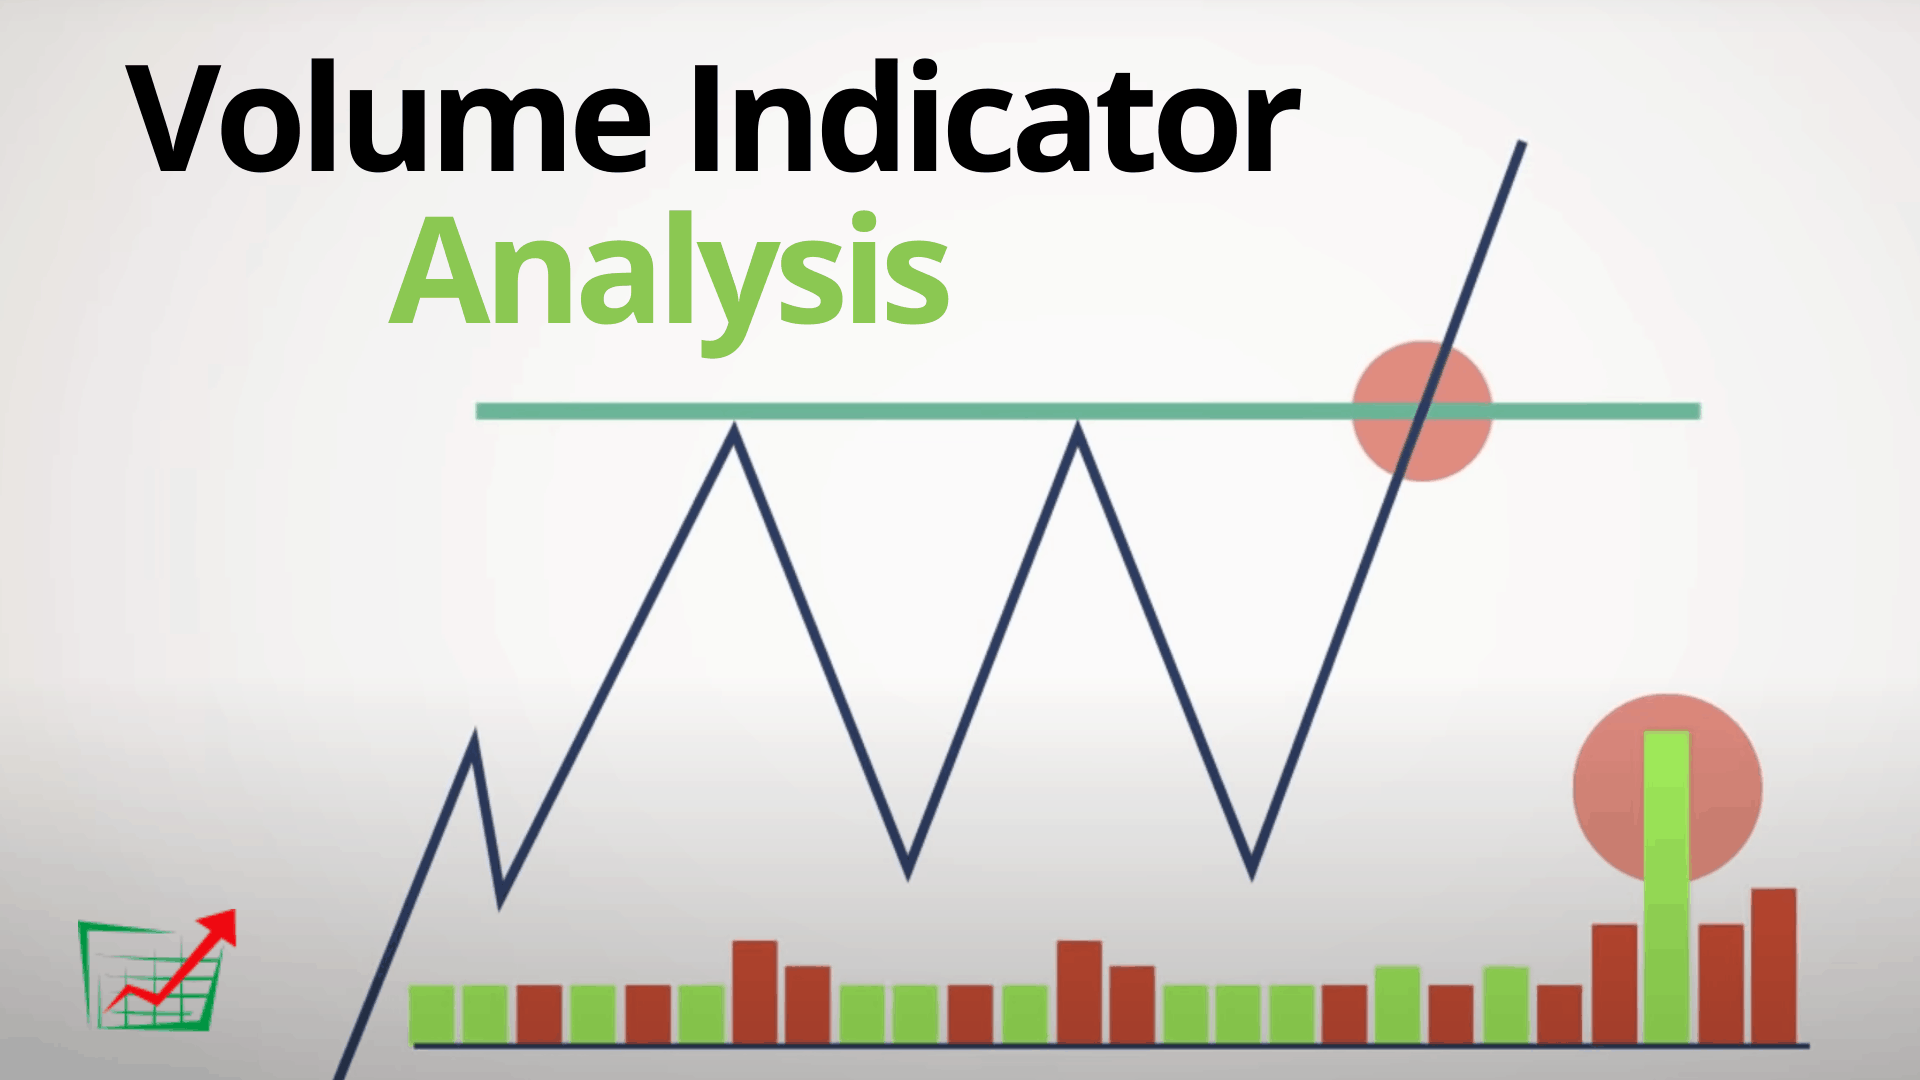
- Double Top and Double Bottom: These patterns indicate potential trend reversals as well. A double top forms after an uptrend, and a double bottom forms after a downtrend. A breakout from these patterns can signal a new trend direction.
- Ascending and Descending Triangles: These patterns represent periods of consolidation. An ascending triangle typically breaks to the upside, while a descending triangle usually breaks to the downside.
- Candlestick Patterns: Candlestick charts display price movements in a specific time frame. Patterns like doji, engulfing, and hammer candles can provide insights into potential price reversals.
Indicators
- Moving Averages: Moving averages smooth out price data and help identify the direction of the trend. The most commonly used are the simple moving average (SMA) and the exponential moving average (EMA).
- Relative Strength Index (RSI): RSI measures the speed and change of price movements. It helps identify overbought and oversold conditions, indicating potential reversal points.
- Moving Average Convergence Divergence (MACD): MACD is a trend-following indicator that shows the relationship between two moving averages. Traders use it to identify potential buy or sell signals.
- Bollinger Bands: Bollinger Bands consist of a middle band (SMA) and upper and lower bands that are based on price volatility. They help traders identify price volatility and potential reversal points.
Incorporating Technical Analysis Into Your Trading Strategy
- Confirmation: It’s essential to use multiple indicators and chart patterns to confirm your trading decisions. A single signal may not be enough to make a trade.
- Risk Management: Set stop-loss orders to limit potential losses in case the market moves against your position. Proper risk management is crucial for long-term success.
- Continuous Learning: The world of technical analysis is vast and constantly evolving. Stay updated with the latest strategies and indicators to improve your trading skills.
- Backtesting: Before implementing a strategy, backtest it on historical data to see how it would have performed in the past. This can provide valuable insights into its effectiveness.